The melograph offers an enriched representation of the musical mode of a melody. Jean-Marc Delaunay had the original idea, Pierre Beauguitte implemented it in this program. Jean-Marc published a large part of his reflexions about modality on his own webpage (in French).
Some knowledge in music theory can be useful to understand this program, but are in no case necessary. We leave aside any mathematical terminology which could be used to give a more formal definition of the melograph. The explanation below has no pretention to be a precise treatise on modality and certainly contains some approximations and imprecisions.
Here is an example of traditional melody (part of a bourrée à 3 temps from Morvan, called bourrée des gars):

The scale of this tune (the notes used) is the following:

It is this set of notes that we call the mode of the melody. This tune is in C: it ends on that note, and C would constitute the "natural" drone to accompany it. Its mode is a major mode, the interval between the first degree (C) and third degree (E) being of two tones.
Let us now have a look at the transitions between the notes of this mode, on the whole melody:
We then represent the mode and these transitions in the following manner:
The result is the following graph, to read from bottom to top on the left hand from top to bottom on the right.
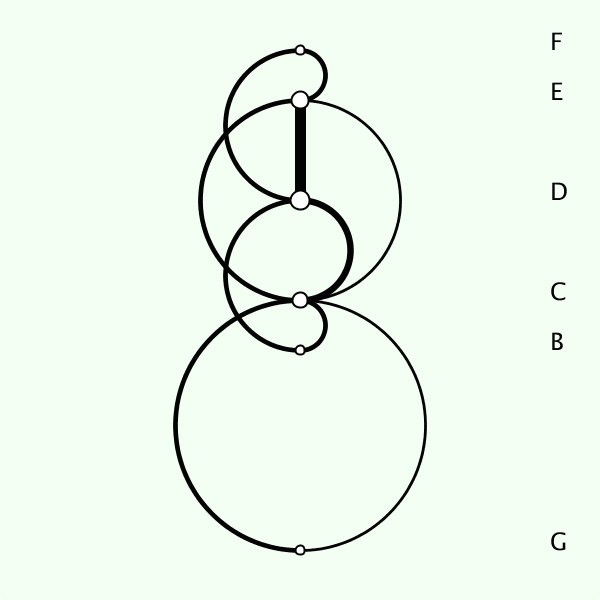
The thickness of arcs and segments and the width of notes correspond to their respective frequencies.
The transitions we found earlier are now represented graphically: G can only be followed by C; C can be followed by E, B or G... We can quite easily trace the melody through the graph.
We see three ways in which the melograph can be used.
First you need to download the program here. Java must be installed on your computer, if it is not already the case you can get it from the official website.
The program opens on a "blank page". You just have to drag and drop a MIDI file on it, and the graph is drawn automatically. The control window then offers several options:
It is also possible to drag and drop a folder containing several MIDI files, in which case the graph represents the notes and transitions appearing in the whole set of melodies. A menu in the control window allows you to select a particular one, its graph is then highlighted.
To switch the interface to English, simply press 'L' while the graph window is active.
MIDI files are common on the Internet. You can find a great quantity of them on the AEPEM site for French music or on thesession for Irish music, or you can create your own with your usual music software.
Original idea by Jean-Marc Delaunay. His webpage (in French).
Program written by Pierre Beauguitte () in Processing.
Sheet music generated by Lilypond.